How to Use Guide
Learn how to build molecular structures and visualize simulation data using Forblaze Mol.
1. Building Structures (System Builder)
Create molecular and polymer unit cells instantly from SMILES strings.
STEP 1: Launch the Builder
On the title screen, switch the Design mode to System (Bulk/Cell) and click the “System Builder” button.
STEP 2: Configure and Add Compounds
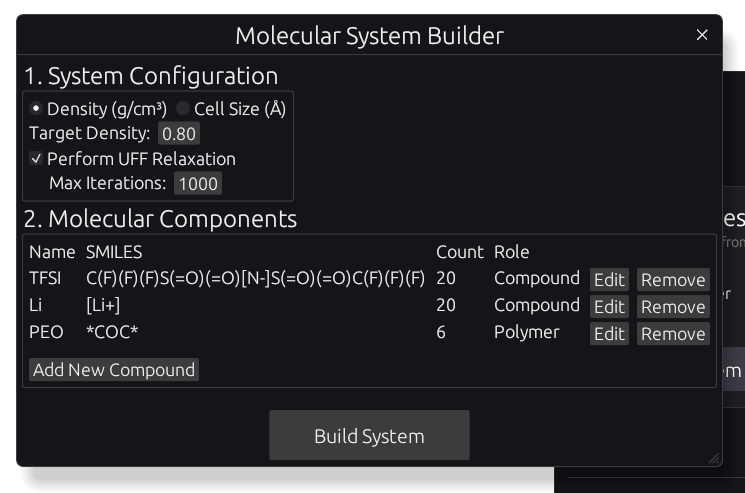
Set the density (or cell size) and structural relaxation (uff-relax) parameters. Click “Add New Compound” and enter the Name, SMILES string, and Count. You can use the “Paste” button to quickly enter SMILES strings from your clipboard.
In this example, we will build a unit cell with TFSI, Li, and PEO (Degree: 20). You can copy the following SMILES strings:
TFSI:
C(F)(F)(F)S(=O)(=O)[N-]S(=O)(=O)C(F)(F)(F)Li+:
[Li+]PEO (Polymer):
*COC*For polymers, represent polymerization sites with asterisks (*) and select the Degree of polymerization (set to 20 for this example) and Tacticity. Click the “Build System” button to start the initial placement and structural relaxation process.
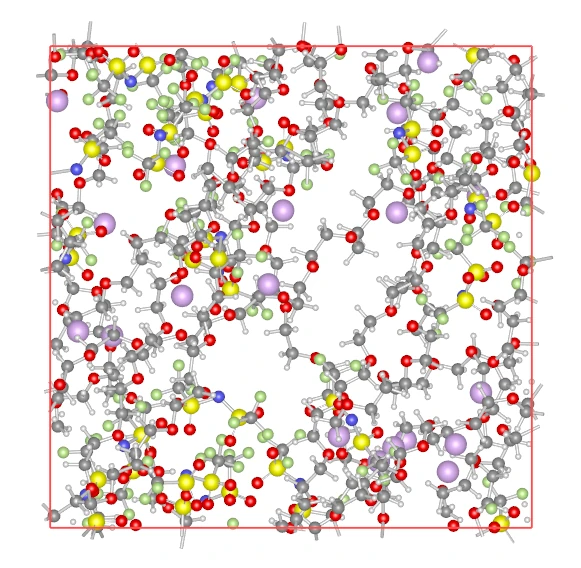
STEP 3: Verify the Structure
Once the relaxation calculation is complete, the built unit cell will be displayed. You can rotate and zoom the model using your mouse to inspect the structure.
STEP 4: Save Data (Export)
Click “File” > “Export Snapshot (.mol2)” to download the structure as a .mol2 file including atomic charges.
2. Visualizing Existing Data (Viewer)
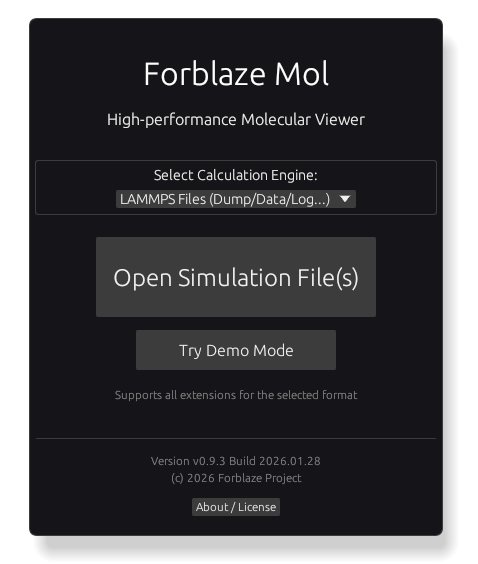
STEP 1: Loading Files
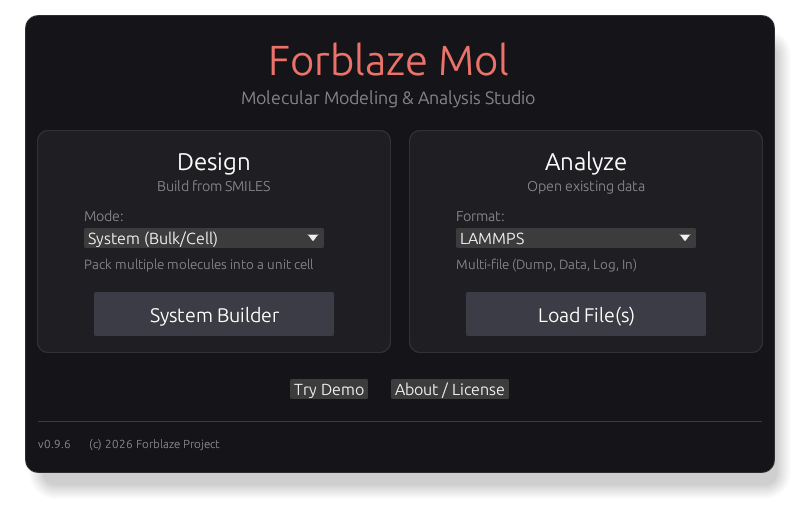
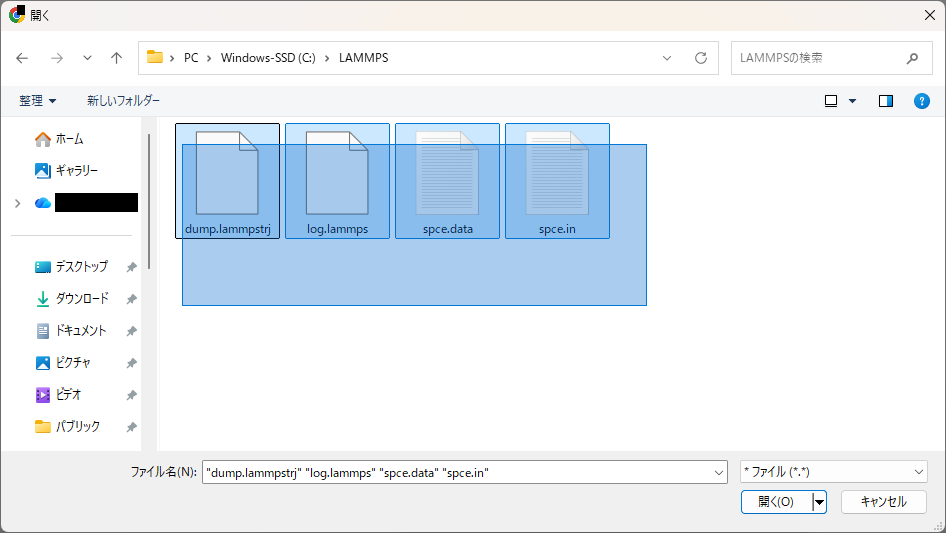
On the title screen, select the Format in the Analyze section, click “Load File(s)”, and select multiple files at once (e.g., a .dump trajectory and a .log file).
STEP 2: Automatic Scan
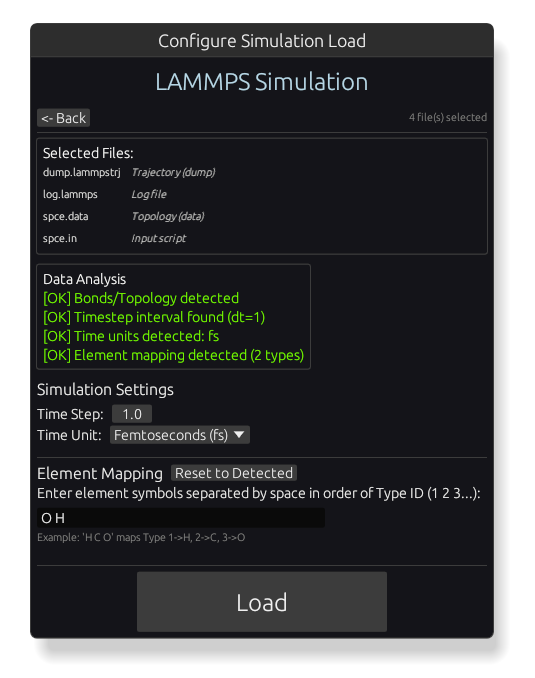
The app automatically scans the files to recognize their formats. Follow the prompts to fill in any missing info and click “Load.”
STEP 3: Navigation
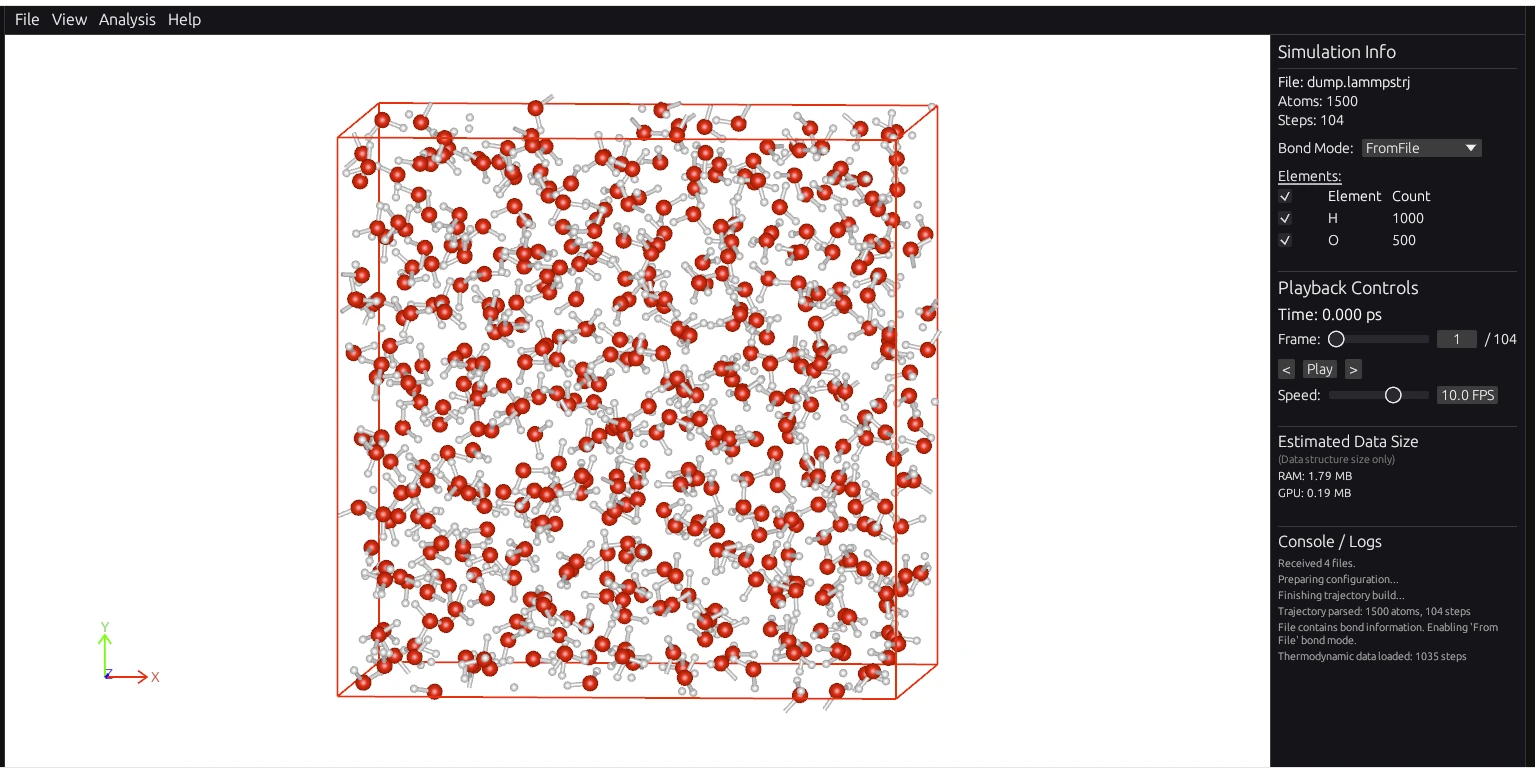
- Left Drag: Rotate
- Right Drag: Pan
- Mouse Wheel: Zoom
STEP 4: Info and Settings
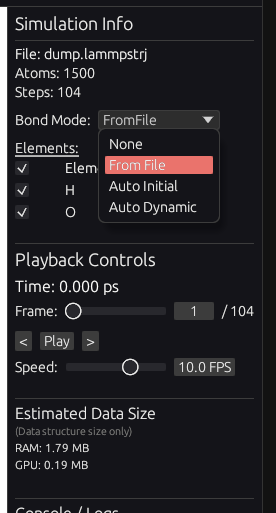
Use the right-side panel to toggle bond displays, filter elements, and control animations.
STEP 5: Charts & CSV
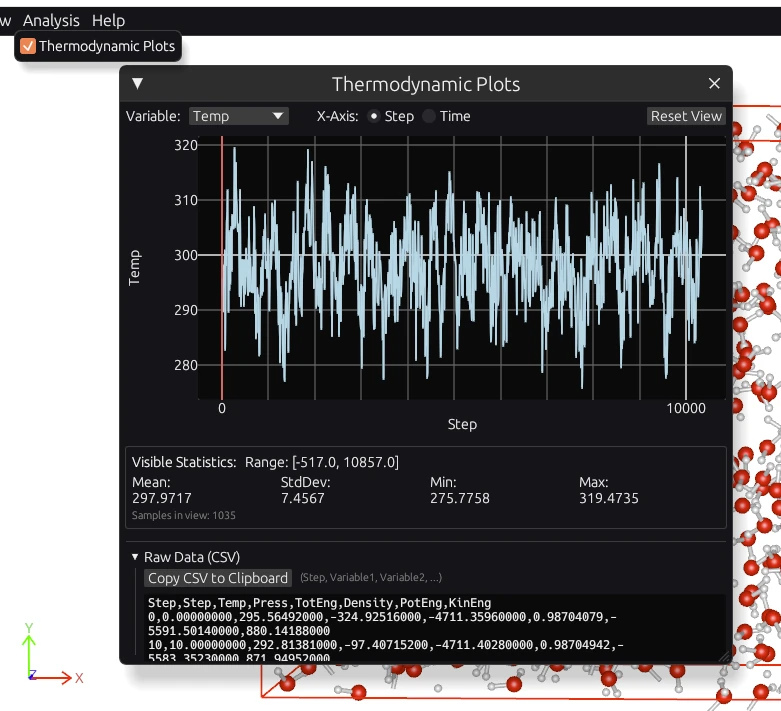
You can display charts via “Plots” in the “Window” menu. Click “Copy CSV” to copy the loaded data to your clipboard for use in Excel or other tools.